The most expensive number on your electricity bill is not your usage
For many commercial and industrial sites, the demand charge can rival the energy charge. Yet it is often one of the least understood and least verified line items on the bill.
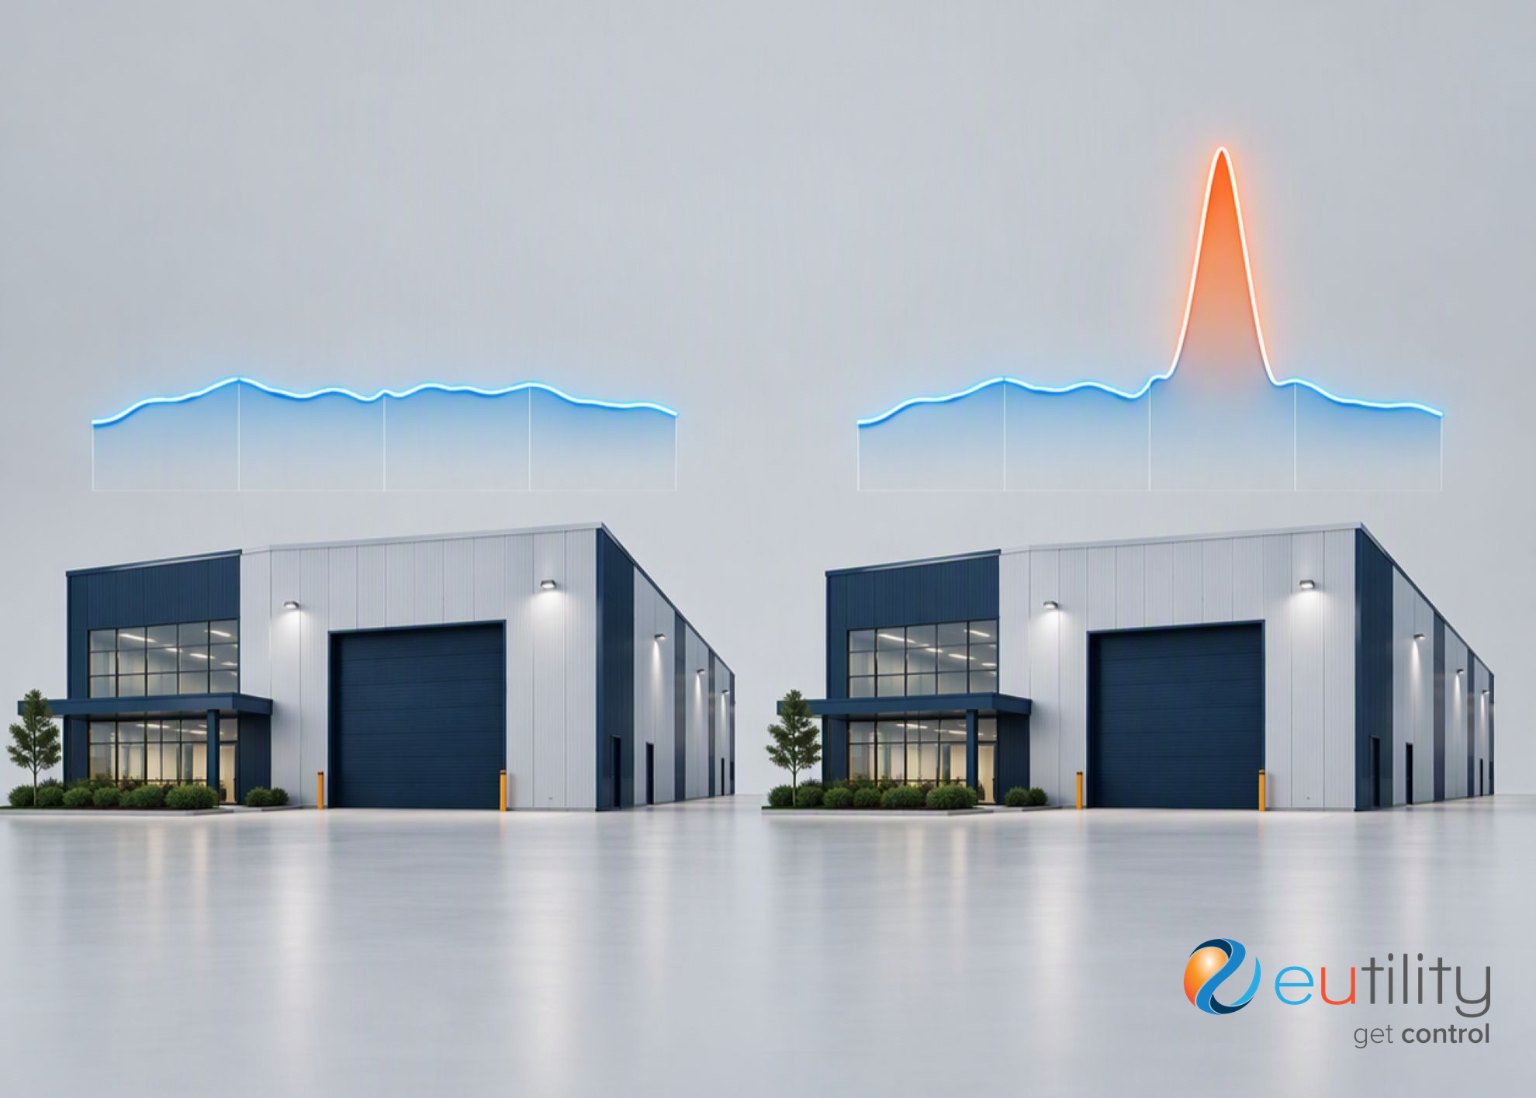
- Demand charges are based on the highest rate a site draws electricity, not total usage, so two sites using the same energy can pay very different charges.
- There is no single calculation method. Each network tariff sets its own rules for kW or kVA, interval length, time window and look-back period, and one invoice can carry several demand charges.
- On kVA tariffs, poor power factor raises the billed demand. A 400 kW site at 0.80 is billed on 500 kVA; at 0.98, about 408 kVA.
- Verifying a demand charge means rebuilding it from interval data and the site's actual tariff rules. A network tariff review then checks the site is on the most cost-effective tariff.
A demand charge is a network charge based on the highest rate at which a site draws electricity, measured in kW or kVA over a 15 or 30-minute interval, rather than on how much energy it uses. How it is calculated depends on the network tariff assigned to the site's NMI, so the same data can produce very different charges.
For many commercial and industrial sites, the demand charge can rival the energy charge. Yet it is often one of the least understood and least verified line items on the bill.
Most people think an electricity bill is a usage report. Use more electricity, pay more. Use less electricity, pay less. For households, that is generally true. For commercial and industrial sites, it is only part of the story.
Many businesses are surprised to learn that some of the largest charges on their electricity bill are not based on how much electricity they used over the month, but on how quickly they used it at a single point in time. That charge is called a demand charge.
In simple terms, energy charges measure how much electricity your site consumed. Demand charges are based on the rate at which your site drew electricity, usually its highest demand during a defined period.
Both can represent significant costs. Depending on your tariff structure, network and operating profile, the demand charge can be one of the largest line items on the bill. That creates an important question:
If one of the largest charges on your electricity bill is based on a single peak event, how certain are you that it has been calculated correctly?
Why can two sites with the same usage pay different demand charges?
Demand charges often catch businesses off guard because they are not linked directly to total consumption. Consider two sites that each use 100,000 kWh during a month.
- Site A operates consistently throughout the month with relatively stable electrical loads.
- Site B uses the same total amount of energy but experiences a large power spike when several pieces of equipment start simultaneously.
Their energy charges may be very similar. Their demand charges may not.
Demand is charged under the rules of the network tariff assigned to the site's National Metering Identifier (NMI), over a specific billing period. Under many tariffs, even a brief spike can create a materially different charge.
How are demand charges calculated?
This is where invoice verification becomes important. Different networks and tariff structures apply different calculation methods. There is no single method for calculating demand charges across Australian electricity tariffs.
Every site is assigned a network tariff by its local network distributor, and that tariff sets the rules: what counts as demand, when it is measured, and how long a peak stays on the bill. The most common types of demand charge are:
- Anytime demand. The highest demand recorded at any time, day or night, in the billing or look-back period.
- Time-of-use demand. Only demand inside a set window counts. Some tariffs have a single peak window. Others charge peak, shoulder and off-peak demand separately, each at its own rate.
- Averaged demand. Instead of a single interval, the charge is based on an average of several intervals within the billing period, such as the average demand across a peak window each day.
- Rolling demand. The charge is based on the highest demand over a longer historical period, generally the last 12 or 13 months, not just the month being billed. One peak can stay on the bill for a year, which is the subject of part 2 of this series.
- Contracted demand. The charge is based on an agreed or fixed level, not what the site drew this month, often with an excess charge if the site goes over it. Some tariffs also set a minimum chargeable demand, so the site pays for at least that level, whatever it draws.
- Critical peak demand. The charge is based on what the site draws on a handful of days, nominated by the network, when the whole network is under the most pressure.
- Coincident demand. Where a site has more than one connection point, demand may be calculated on the combined load across them at the same moment, or on each connection point separately.
Different networks offer different tariffs, and each tariff uses its own combination of these types. One invoice can carry several demand charges, each calculated differently. On SA Power Networks' large low voltage tariffs, for example, an anytime demand charge based on the highest half-hour in the last 12 months appears on the same invoice as a peak demand charge that averages demand across a time window.
Names can be misleading too. A charge labelled “capacity” may be a fixed, contracted figure on one invoice and a rolling 12-month maximum on another. In Western Australia, it can also mean a wholesale market charge, not a network charge at all. What matters is how a charge is calculated, not what it is called.
Other factors where demand charges can differ include:
- kW or kVA. Some tariffs measure demand in kilowatts (kW), others in kilovolt-amperes (kVA), and many networks use both across their tariffs.
- 15-minute or 30-minute intervals. Most demand is currently measured over 30-minute intervals, but some tariffs use 15 minutes, which captures shorter spikes. The same network can use both, for example CitiPower's large business tariffs measure demand over 15 minutes, while its flexible large business tariff uses 30 minutes.
- Time bands. The hours that count as peak are not the same across one network's tariffs. On CitiPower's network, for example, the peak period on large business tariffs runs from 7am to 7pm on workdays, while demand on its small and medium business demand tariffs is measured between 10am and 6pm on workdays. Its large business tariffs also carry a separate incentive demand charge for four months of the year, measured from 1pm to 4pm in summer, 4pm to 7pm in summer, or 4pm to 7pm in winter, depending on which version of the tariff the site is on.
Even this is a simplification, and newer tariffs add further variations. SA Power Networks' flexible connection tariff, for sites that keep their imports and exports within time-varying network limits, charges demand at a lower rate and over a narrower peak window.
Rules also change. Each network's tariff structure statement, a five-year plan approved by the Australian Energy Regulator, sets out how it can recover its costs from customers. When CitiPower and Powercor's new statement took effect on 1 July 2026, the 120 kVA minimum chargeable demand on their large low voltage tariffs was removed. A charge that was right last year may not be right this year.
This means the same site demand data can produce very different charges depending on which tariff rules are applied.
Each network tariff has its own defined calculations. What matters is that the invoice applies the rules of the tariff your site is actually assigned to. If the wrong basis, window or look-back period is configured in the billing system, the demand charge may look perfectly normal on the invoice and still be wrong. For sites where demand is a significant share of electricity spend, even a small error repeats month after month.
Checking a demand charge properly means modelling every one of those rules. In Eutility's validation system, each charge in a tariff is set up individually: the rate, whether it is measured in kW or kVA, the interval length, the time window and whether public holidays count, the look-back period, and any minimum or rounding rule. During validation, the system matches the demand intervals in the site's interval data against those rules, so we can confirm the right interval set the charge and the calculation is correct. The invoice is then rebuilt and compared line by line with what was billed, and any variance of more than about 1% is flagged for review.
Why can poor power factor increase demand charges?
On a kVA tariff, how efficiently your site uses power affects the bill. kW is the real power your equipment uses to do work. kVA is the total power the network has to supply to deliver it. The ratio between the two is your power factor.
Ergon Energy Network puts it plainly: “If a site has low power factor, the demand charges will be higher than if the site had a good power factor.”
Take a site drawing 400 kW at a power factor of 0.80. It is billed on 500 kVA. At 0.98, the same load is billed on about 408 kVA. The work done is identical. The demand charge is not.
At $12.54 per kVA per month, the rolling demand charge on one of CitiPower's large low voltage tariffs, that is the difference between $6,270 and about $5,120 a month. Over a year, the site at 0.80 pays about $13,800 more for the same work.
Power factor correction equipment can close that gap. How quickly the saving appears depends on how the tariff measures demand:
- Monthly maximum demand. Demand is recalculated every month, so the saving shows up on the next bill.
- Rolling demand. The old peak stays on the bill until it drops out of the 12-month window, unless the network agrees to reset it. CitiPower and Powercor, for example, may approve a reset once the equipment is installed and certified, with demand then measured from the date it was commissioned.
- Contracted demand. The contracted figure has to be changed with the network before the saving can flow through.
Whichever applies, the result should be tracked on the bills that follow, especially on rolling and contracted demand tariffs. Our approach is to prepare the business case, apply to the network for the change, and then track the result on each bill.
Eutility's Power Factor at Max Demand report supports each step. For every meter and every month, it shows the date and time the maximum demand was recorded, the demand value and whether it is in kW or kVA, and the site's power factor at that moment, alongside its annual consumption. Before correction, it shows how much poor power factor is adding to the billed demand. Afterwards, it confirms the power factor at peak has improved and lets us check that the lower demand is flowing through to the bill.
How can a single event create a large demand charge?
Another challenge is how demand peaks are created. A demand peak is not necessarily a reflection of normal operations. It can be triggered by a single event.
Large motors, compressors, refrigeration systems and other electrical equipment can draw significant power during start-up. If several major loads start within the same interval, the site's recorded demand can rise well above its normal operating level.
The peak may occur once. The demand charge may remain for the entire month, and under a rolling tariff, for a year or more.
Not every excess charge comes from a spike, though. Some come from the capacity figure itself. Maximum demand estimates made when a site is designed are deliberately conservative. If a contracted or authorised demand is based on that estimate and never revisited, the site can pay for capacity it does not use, every month. Some sites are also billed a fixed, agreed capacity that recovers the network's capital cost of the infrastructure built for the site, rather than reflecting the site's actual load profile.
For businesses focused primarily on total energy consumption, both are often invisible. The invoice simply displays the final number.
Why do demand charges get so little scrutiny?
This is the irony of demand charging. Many organisations carefully review:
- Consumption trends
- Retail rates
- Contract pricing
- Budget variances
Yet the demand charge, which can represent a substantial portion of electricity costs, is frequently accepted without independent verification. Checking it properly takes two different reviews, and they answer two different questions.
Invoice validation: is the bill right?
Validation checks that the charge has been calculated correctly under the tariff the site is on. To confirm a demand charge, five things need to be validated:
- The tariff on the invoice matches the network tariff assigned to the site's NMI.
- The correct demand basis has been applied: kW or kVA, and the right type of demand, whether anytime, time-of-use, averaged, rolling, contracted or critical peak.
- Demand has been measured over the correct interval (15 or 30 minutes) and in the correct window, including seasons, business days and public holidays.
- The demand value on the invoice matches the site's interval data, including power factor on kVA tariffs and how any multiple connection points are combined.
- Any tariff change, demand reset or rolling peak has been handled correctly, and an old peak has dropped off when it should.
If any one of these elements is wrong, the charge has not been verified. It has simply been assumed to be correct.
Network tariff review: is it the right tariff?
A network tariff review (NTR) asks a different question. Even if every bill is calculated correctly, is the site on the most cost-effective tariff for the way it uses power? Sites are often eligible for more than one tariff, and the best choice can change as the site's usage changes and as networks reset their prices each year.
What can a network tariff review find?
Two examples from Eutility's network tariff reviews show what that question can be worth.
A swimming pool facility in NSW: $125,000 a year off its total bill
The site was using close to 2.5 GWh of electricity a year. From the start, it had been billed on a network tariff designed for small sites using less than 160 MWh, a limit it exceeded more than 15 times over.
That tariff had no demand charge and a daily charge of under a dollar, but its network energy rate was about 9 to 10 cents per kWh. The tariff the site actually qualified for has a demand charge of roughly 30 to 36 cents per kVA per day and a daily charge of about $28, but network energy rates of between about 2 and 4.5 cents per kWh, less than half. For a site using that much energy, the lower energy rate far outweighed the demand and daily charges.
The organisation managed its own electricity contracts and focused on the retail rate, so no one had checked the network tariff. Our review moved the site to the correct tariff suitable for the site, cutting about $125,000 a year from its total electricity bill, and recovered a further $37,000 in backdated charges. The new tariff added a demand charge, but the drop in energy charges was far larger.
A wine estate in NSW: $340,000 a year off its total bill
The estate uses around 3.9 GWh of electricity a year. It was on a single-rate demand tariff.
At the time, that tariff's network energy rates were roughly 5 to 12 cents per kWh. The three-rate demand tariff for large business sites had network energy rates of under 1 cent per kWh (0.17 to 0.71 cents in 2017-18), recovering most of its cost through peak, shoulder and off-peak demand charges. Peak demand rates on the two tariffs were similar, so the difference came down to the energy rate. At 3.9 GWh a year, that gap adds up quickly.
The business had concentrated on its retail rates and had not looked at its network tariff. After our review, it moved to the three-rate demand tariff, cutting about $340,000 a year from its total electricity bill.
In both cases, the attention had gone to the retail rate, and the saving was sitting in the network tariff.
Both sites also moved onto tariffs that rely more on demand charges, not less. On the optimal tariff, a much larger share of each site's network cost now comes through demand. That is why validating how that demand is calculated matters even more.
How can a site reduce its demand?
Choosing the right tariff and checking the bill both work with the demand a site already has. The next step is to lower it.
Common approaches include staggering the start-up of large equipment so it does not peak in the same interval, correcting power factor on kVA tariffs, and moving flexible loads out of the peak window. An ice manufacturer, for example, can make and store ice overnight, so its compressors are not working flat out during the afternoon peak.
Under a rolling or critical peak charge, timing matters most: avoiding one peak can lower the bill for a year. Eutility's daily alerts, reviewed by our engineers, flag significant demand spikes so the cause can be found and fixed before it happens again.
Why can't you check a demand charge from the invoice alone?
The challenge is that none of this can be confirmed from the invoice itself. The billed demand value may appear reasonable. The tariff applied may sound familiar. The charge may even look consistent with previous months.
But unless the underlying interval data and tariff rules have been tested, there is no way to know whether the charge was calculated correctly.
Has anyone actually verified your demand charges?
Most organisations assume their demand charges have been calculated correctly. Far fewer have independently verified them. If you're unsure whether that verification has ever been done, Eutility can help.
Our invoice validation and energy monitoring services compare billed demand charges against interval data and the rules of each site's network tariff. Our annual network tariff reviews check that every site is on the most cost-effective tariff. Together, they help organisations identify discrepancies before they become ongoing costs.
Call 1800 676 098 or email customerservice@eutility.com.au.
Where can you find the demand rules for your network?
Each distributor publishes its tariff rules and prices every year. These are the primary sources to check a site's demand calculation against.
- Eutility. We keep a national, annually updated database of network tariffs and can check your site's demand charges against it. Call 1800 676 098 or email customerservice@eutility.com.au.
- National. Australian Energy Regulator, network pricing proposals and tariff variations (every network's approved tariffs); Energy Made Easy, Understanding network tariffs.
- NSW. Ausgrid network prices; Endeavour Energy network price list; Essential Energy network price list and explanatory notes.
- ACT. Evoenergy electricity network pricing.
- Victoria. CitiPower and Powercor pricing and large business tariffs fact sheet; Jemena network tariff schedule; AusNet network tariffs; United Energy pricing.
- Queensland. Energex network tariff guide; Ergon Energy network tariff guide.
- South Australia. SA Power Networks large business tariff information.
- Tasmania. TasNetworks distribution prices.
- Western Australia. Western Power price list.
- Northern Territory. Power and Water Corporation pricing proposal.
Sources
- Ausgrid, Network prices (accessed October 2026).
- CitiPower and Powercor, Large business tariffs fact sheet, June 2026 (accessed October 2026).
- CitiPower, Revised Tariff Structure Statement 2026-31, published by the Australian Energy Regulator, April 2026 (accessed October 2026).
- AusNet Services, 2025-26 Statement of compliance (network tariffs), published by the Australian Energy Regulator, March 2025 (accessed October 2026).
- SA Power Networks, Large business tariff information (accessed October 2026).
- Australian Energy Market Operator, Reserve Capacity Mechanism (accessed October 2026).
- Ergon Energy Network, Power factor (accessed October 2026).
Keep reading


Has anyone verified your demand charges?
Eutility checks billed demand charges against your interval data and the rules of each site's network tariff, and reviews whether every site is on the most cost-effective tariff. Email customerservice@eutility.com.au or call 1800 676 098.